Python - Matplotlib テキスト追加
この記事は、Python内のmatplotlibライブラリを使用してグラフにテキストを追加する方法を説明するために作成されました。
matplotlibを活用してグラフを出力する際、以下のようにグラフ上にテキストを追加してみましょう。

まず、以下のように任意の月別売上数量のデータを持って実装しましょう。
>>> import calendar

>>> month_list = [1, 2, 3, 4, 5, 6, 7, 8, 9, 10, 11, 12]
>>> sold_list = [300, 400, 550, 900, 600, 960, 900, 910, 800, 700, 550, 450]

>>> fig, ax = plt.subplots()
>>> barcharts = ax.bar(month_list, sold_list)

# calendar.month_name[1:13] → xlabelに1月から12月まで出力
>>> ax.set_xticks(month_list, calendar.month_name[1:13], rotation=90)

>>> print(barcharts)
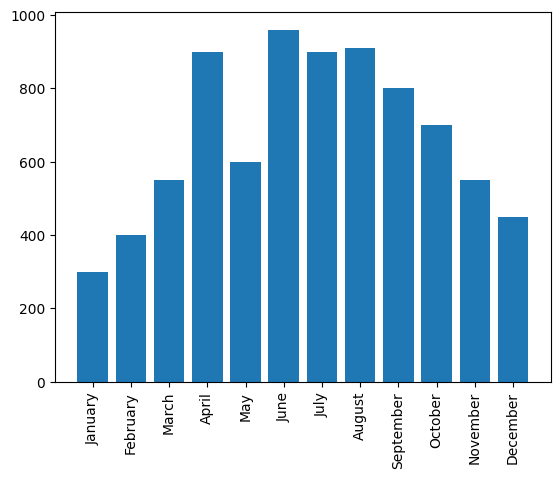
コードを実行すると、以下のようなグラフが出力されます。

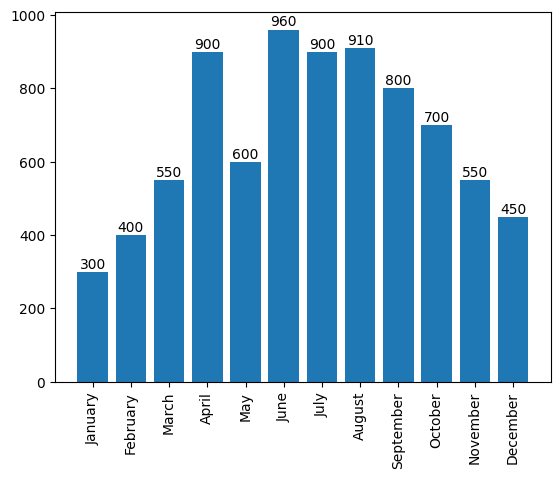
次に、各バー上に該当するy値を追加しましょう。
各バーの値を得た後、テキストとして追加するためには、y値を出力するget_height()とバーにテキストを入力するax.text()を使用します。
参照:
get_height()
https://matplotlib.org/stable/api/_as_gen/matplotlib.patches.Rectangle.html
ax.text()
https://matplotlib.org/stable/api/_as_gen/matplotlib.axes.Axes.text.html#matplotlib.axes.Axes.text
完成したコードは以下の通りです。
>>> import calendar

>>> month_list = [1, 2, 3, 4, 5, 6, 7, 8, 9, 10, 11, 12]
>>> sold_list = [300, 400, 550, 900, 600, 960, 900, 910, 800, 700, 550, 450]

>>> fig, ax = plt.subplots()
>>> barcharts = ax.bar(month_list, sold_list)
>>> ax.set_xticks(month_list, calendar.month_name[1:13], rotation=90)

>>> print(barcharts)

>>> for rect in barcharts:
    height = rect.get_height()
    ax.text(rect.get_x() + rect.get_width()/2., 1.002*height,'%d' % int(height), ha='center', va='bottom')

>>> plt.show()
rect.get_x() + rect.get_width()/2.
各バーのX位置と幅の中間点を計算します。これはバーの横軸中心を表します。
1.002 * height
heightは現在のバーの高さであり、1.002*heightはバーの高さよりも少し上にテキストを配置するための補正値です。
’% d’ % int(height)
文字列フォーマッティング、つまり、各バーごとの高さ値を追加(%の後に来るd(整数)を追加、int(height)はバーの高さを整数に変換)
ha=‘center’
水平(x軸)の配置を中央に合わせます。
va=‘bottom’
垂直(y軸)の配置を下に合わせます。
したがって、コードを実行すると以下のように出力されます。
