Python - Matplotlib Text Insertion
This article explains how to insert text into graphs using the matplotlib library in Python.
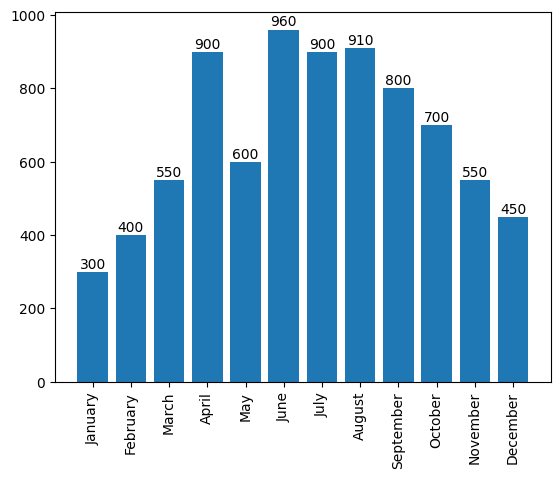
When outputting graphs using matplotlib, let’s try inserting text onto the graph as shown below.

First, let’s implement it using arbitrary monthly sales data as shown below.
>>> import calendar

>>> month_list = [1, 2, 3, 4, 5, 6, 7, 8, 9, 10, 11, 12]
>>> sold_list = [300, 400, 550, 900, 600, 960, 900, 910, 800, 700, 550, 450]

>>> fig, ax = plt.subplots()
>>> barcharts = ax.bar(month_list, sold_list)

# calendar.month_name[1:13] → Outputs January to December on xlabel
>>> ax.set_xticks(month_list, calendar.month_name[1:13], rotation=90)

>>> print(barcharts)
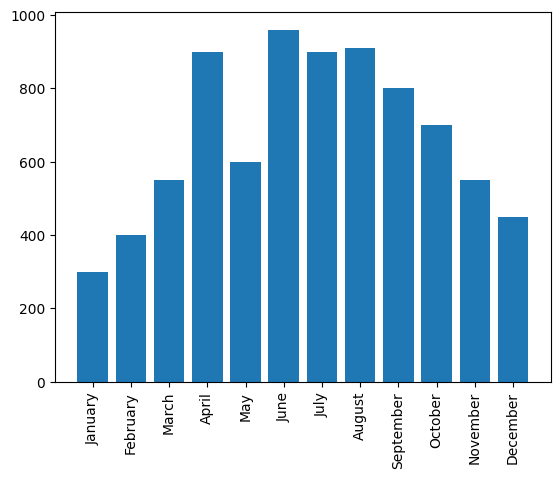
When you run the code, a graph like the one shown below is output.

Next, let’s insert the corresponding y-value above each bar.
After obtaining the value for each bar and to insert it as text, we use get_height() to output the y-value and ax.text() to input text into the bar.
Reference:
get_height()
https://matplotlib.org/stable/api/_as_gen/matplotlib.patches.Rectangle.html
ax.text()
https://matplotlib.org/stable/api/_as_gen/matplotlib.axes.Axes.text.html#matplotlib.axes.Axes.text
The completed code is as follows:
>>> import calendar

>>> month_list = [1, 2, 3, 4, 5, 6, 7, 8, 9, 10, 11, 12]
>>> sold_list = [300, 400, 550, 900, 600, 960, 900, 910, 800, 700, 550, 450]

>>> fig, ax = plt.subplots()
>>> barcharts = ax.bar(month_list, sold_list)
>>> ax.set_xticks(month_list, calendar.month_name[1:13], rotation=90)

>>> print(barcharts)

>>> for rect in barcharts:
    height = rect.get_height()
    ax.text(rect.get_x() + rect.get_width()/2., 1.002*height,'%d' % int(height), ha='center', va='bottom')

>>> plt.show()
rect.get_x() + rect.get_width()/2.
Calculates the midpoint of the x position and width of each bar. This represents the center along the horizontal axis of the bar.
1.002 * height
height is the current height of the bar, and 1.002*height is a correction value to place the text slightly above the height of the bar.
’% d’ % int(height)
String formatting, i.e., inserting the height value for each bar (% follows d(integer) for insertion, int(height) converts the height of the bar to an integer)
ha=‘center’
Aligns horizontally (along the x-axis) to the center.
va=‘bottom’
Aligns vertically (along the y-axis) to the bottom.
Therefore, when you run the code, it will be output as shown below.
